on now
This number shows an up-to-the-second assessment of human-induced global warming since the second half of the 19th century.
In the 2015 Paris Agreement countries around the world agreed to work towards keeping global warming below 2 degrees – and ideally at 1.5 degrees – in order to avoid the worst impacts of climate change.
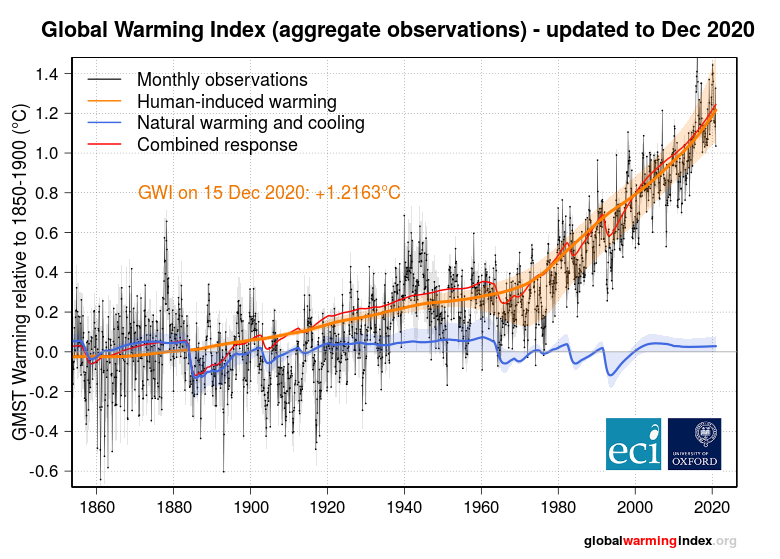
This graph shows how global temperatures have risen over the past 170 years, using attribution science
to understand the causes of this change and smooth out natural fluctuations.
The black line shows real-world observations of global mean temperature. Although there is some year-to-year variation, the Earth’s temperature has been steadily increasing since the 1960s.
This cannot be explained by natural causes. The blue line shows the estimated contribution to Earth’s temperature change from natural causes, such as changes in solar activity and volcanic eruptions. These account for some of the variation in global temperatures, but they can’t explain the overall warming.
The orange line shows the estimated contribution from human-induced global warming, caused by the burning of fossil fuels or other forms of pollution. Since this line closely follows the temperatures observed in the real world, it shows that the overall warming can largely be attributed to human activity. However, it is still not an exact match.
The red line shows the combined impacts of human-induced and natural changes. This line most closely matches the observed temperatures, and shows that human-induced changes, plus some natural forcing, has caused the global warming we see today.
Find out more about attribution science in this video from Dr Friederike Otto, one of the pioneers of attribution science.
More technical information about these calculation can be found here.
What contributes to human-induced global warming?
This number shows an up-to-the second assessment of total global carbon dioxide emissions (CO2). CO2 emissions are the biggest contributor to human-induced climate change.
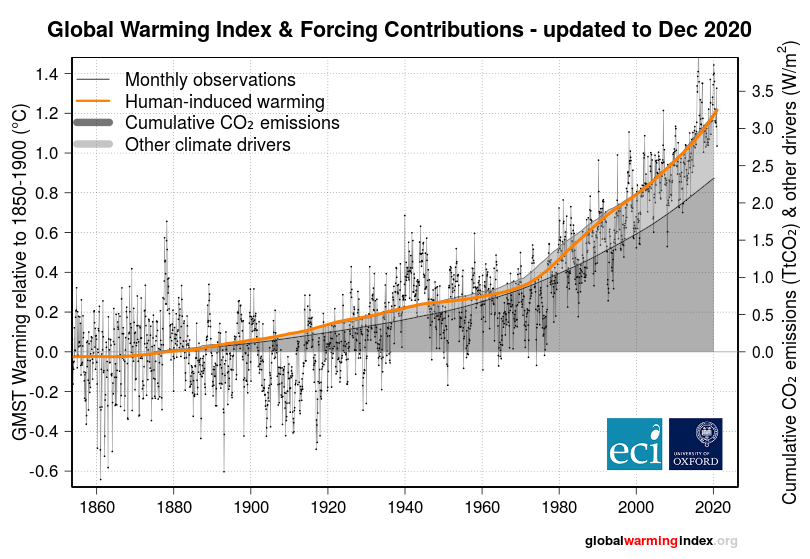
This graph shows how the main drivers are contributing to human-induced global warming.
The dark grey shows CO2 emissions added up over time.
CO2 emissions account for the majority of global warming.
In the 2015 Paris Agreement countries around the world agreed to work towards achieving ‘net zero’ carbon dioxide emissions. First and foremost, this means reducing CO2 emissions.
In order to meet climate targets, it will also be necessary to remove some CO2 from the atmosphere. This could be done by through biological pathways such as forest restoration, or through technologies such as carbon capture and storage.
What else contributes to human-induced global warming?
This number shows an up-to-the second estimate of other human influences on climate.
These changes cause an additional amount of heat energy to be trapped in the climate system, contributing to global warming, measured in W/m2.
How do CO2 emissions and other climate drivers contribute to global warming?
In the second figure above, the total human-induced global warming (orange line) estimated from observed temperatures is given almost exactly by simply adding the warming caused by CO2 emissions (dark grey) to the warming caused by other human activities (light grey): all lines of evidence agree on what is driving global temperature change.
Human-induced warming (ΔT) over a time-interval ranging from seconds to decades is proportional to total cumulative carbon dioxide emissions over that time-interval (E) plus the impact of any change in global energy imbalance due to other human influences on climate (ΔF).
We can write this as an equation [1]:
$$ {\color{red} {ΔT}} = {\color{blue}κ} ⋅ \left( E + {{ {\color{grey} { ΔF }} } \over {\color{blue}α}} \right) $$
where κ is the “Transient Climate Response to Emissions” (about 0.4°C per trillion tonnes of CO2 [2]) and α is the “Normalised Absolute Global Warming Potential” of CO2 (about 1.0 W/m2 per trillion tonnes of CO2 [3]).
The Global Warming Index is run by researchers from the Environmental Change Institute at the University of Oxford.
See here for further details about the numbers, graphics, and methods used above.
[1] Allen et al, npj Clim Atmos Sci 1, 16 (2018)
[2] Myhre et al (2013) in IPCC 5th Assessment Report, incl. uncertainty range of 0.23-0.68°C/TtCO2.
[3] α = AGWPCO2/H, where H is the AGWP time-horizon. Myhre et al (2013) give values of 0.9-1.2 W/m2 per trillion tonnes of CO2 in the 20-100 yr range.